 This week I was introduced to the dust echoes website, which contains short animation films relating to Aboriginal stories and culture. It was not one that I had heard of before, but I am glad I have had the opportunity to see it as I think it is a great site and one that I hope to use in the future. Each film also has an accompanying study guide which is a great teacher resource.
 We watched the 'Mermaid Story' film together and were then asked to choose one film to watch, and then use the Inspiration program we were introduced to in week one to re-tell the story through images and text. 

I chose to watch 'Brolga Song' and then I used MS Paint to capture images from the film and upload them into Inspiration. We were then able to move about the room and see each other's work, and some of the creative ways that people had chosen to lay out their story's were amazing. I think this would be a great English exercise for students to undertake, as it particularly relates to sequencing.
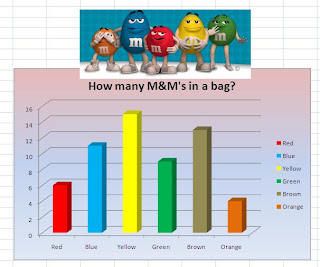
The second half of this week's workshop was all about MS Excel. I have used Excel a lot in my previous jobs, and have created many graphs and charts in my time! Today we used M&M's as the data to be included in the spreadsheet, and created a chart that depicted the number of different coloured M&M's were in a bag.

One thing I learnt that I hadn't really explored in Excel before was to make the charts fun - make it colourful and drop in images. We used the M&M website to find images to include, and this is easily something that Primary students could do too. Interpreting and understanding the graphs is the next step for students to extend their knowledge. This could be done by adding more visuals to the graphs such as labelling the data. Students could combine their results to create a new set of data and new charts to compare the differences, or even use another bag of M&M's to see whether the results are similar.
I have always recognised that graphs and data is essential in the maths curriculum, but today really showed me that there are easy ways to make it fun for the students.
No comments:
Post a Comment
Note: Only a member of this blog may post a comment.